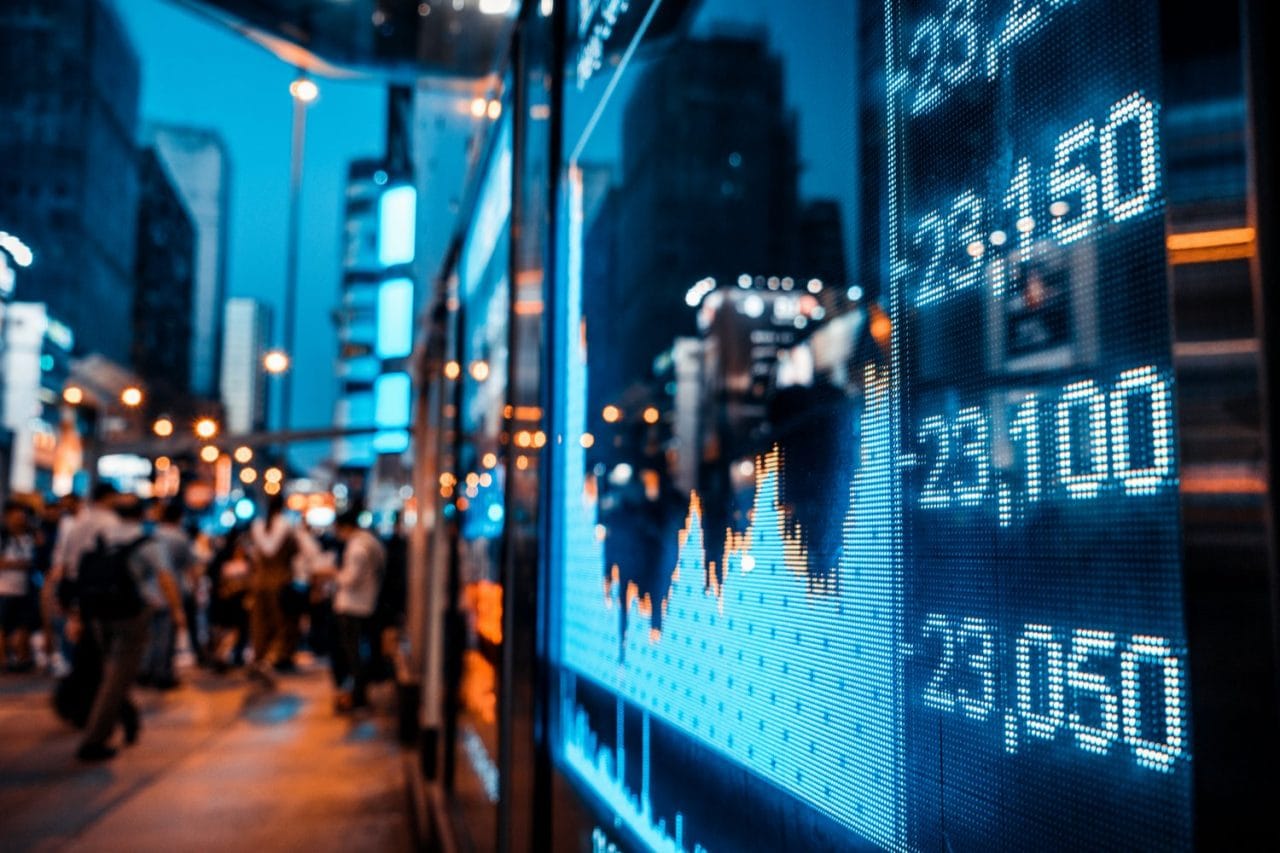
Shiba Inu has surpassed the expectations of many cryptocurrency traders. Everyone wants to know if it can keep growing. So far, the coin has managed to birth a $5.7 Billionaire, who invested $8000 in 2020. Therefore, the question on everyone’s mind is: will Shiba Inu keep rising? Looking at the charts and analysis, here are some of the few reasons why it seems the coin will keep growing. Bullish Market: As of now, Shiba Inu is painting the markets green, disappointing the bears. The coin has managed more than a fifty percent gain from its previous All-Time High (ATH) of $0.000060 to $0.000084, which has now become its new ATH. Believe it or not, this is a +150,000,000 percentage since its launch in 2020. The coin has had a total of 900% gains just within the past month. Increase in Shiba Inu’s Market Cap: The coin has had massively exponential growth compared to any real-world tokens, including the stock market. It now holds a larger market cap and trading volume than its inspiration, Dogecoin. Dominant Memecoin: Shiba aims to be a dominant meme coin, and from the way the charts are rising, that seems to be in the cards. Even though the currency has no use case, for now, there are speculations for transaction functions.
Shiba Inu had massive whale buying late last month, which shows that the large institutions could be looking to make real value off the coin. Even though, admittedly, the cryptocurrency market is highly unpredictable, and anything is possible; it is easy to turn a coin with no use case into a real-value asset. Daily Analysis by Crypto Experts: Many cryptocurrency and trade analysts have taken a keen interest in this coin, and its massive gains last week leave many questioning, predicting, and analyzing price charts. There is speculation about a massive correction coming soon. However, constant analysis of a coin is usually a bullish sign. Even when the currency experiences a bear market, if past patterns hold true, it will only be for a short period due to cashing out and the coin will soon shoot up again. Shiba Inu Projects: LEASH and BONE are two projects on ShibaSwap, a Shiba Inu Dex. The tokens are among the reasons Shiba will keep rising – LEASH is a scarce token used for offering incentives on ShibaSwap, whereas BONE is used for holders as a governance token to vote for Doggy DAO proposals.
Simply put, new cryptocurrency technologies make coins rise in price; additionally, the bullish market has made the coin popular for listing in most exchanges. Exchanges like to list coins with a massive trading volume if for no other reason, because the traffic of the currency yields profit. Listings usually lead to an increase in the price of any crypto coin; therefore, all of these reasons point to a bullish projection. $1 Shiba Possibility? Finally, the Twitter community in the crypto space greatly affects the rise and fall of a coin. Testimonies from Shiba Inu millionaires are influencing an increase in buying, hence a price rise. Many people in the crypto space speculate that the coin will reach $1, and the number one rule is always to buy the rumors. Therefore, it does not seem like anything will come in the way and buying will not stop anytime soon. Most likely scenarios play out, and it seems that Shiba Inu will keep rising, especially in the coming months.
Goldman Sachs predicts $8,000 per Ethereum (ETH) by the end of 2021
As the year gradually draws to a close, a number of high-profile analyst predictions have begun to emerge about where the value of some of the leading digital assets will be at year’s end. The latest is from leading investment bank Goldman Sachs, who predicted that Ethereum’s value could rise to $8,000 before the end of the year. Ethereum to hit $8,000: According to a research note, attributed to Bernhard Rzymelka, who is Goldman Sachs’s Global Markets managing director, the second largest crypto asset by market cap could be a viable hedge against inflation. As such, this knowledge will likely lead investments in ETH, which would raise its value to as high as $8000. The note continued: crypto assets generally tend to trade in line with inflation break evens since 2019. This trend has often played a role in pushing the price of digital assets higher in the market. The bank’s statement aligns with an age-long belief in the crypto community that rising inflation in the world would lead to an upsurge in the value of digital currencies.
Ether could hedge against inflation, and while many analysts have repeatedly chosen Bitcoin as their most preferred asset to hedge against inflation, Rzymelka declared that one possible use case for Ethereum could be as a hedge against rising inflation. Using the Bloomberg Galaxy Crypto Index and a USD 2-year forward 2-year inflation swap as a point of reference, the Goldman Sachs’s Managing Director noted that: “The local backdrop looks supportive for Ethereum… the latest spike in inflation break evens suggests upside risk if the leading relationship of recent episodes was to hold.” Ethereum’s value has risen by over 30% within the last 30 days, and it is now priced over $4,600. Goldman Sachs predicts $8,000 per Ethereum (ETH) by the end of 2021.
Bitcoin Price Hits 1 Week High as it Soars $1,500 in Minutes
Currently trading at $62,341, Bitcoin was up about 0.87% last week. During the past thirty days, Bitcoin is up by over 30%, and the days of sideways movements at least temporarily ended with a brief but strong breakout. Bitcoin’s price surged to a weekly high as the Premier Cryptocurrency grew by approximately $1,500 in just minutes. Analyst Filbfilb stated, “We haven’t lost the MR line & found resistance there, but I’m expecting the next move to happen in the next 48 hours.” The analyst based his projection on the relative strength index, noting that the coin’s RSI is above 70, which is a classic “prelude” to an impending extended rally. RSI levels are important both for projecting multi-months highs and potential market exit opportunities. Bitcoin to Reach $100k: Many crypto enthusiasts, including Graham Jenkins, CEO at CoinList, seem to be backing the commonly held projection that BTC will cross $100,000 by the end of the year.
Recently talking to CNBC, Jenkins stated that most of his teammates are betting that Bitcoin is going to be worth over $100k by the end of this year. It has been a long-awaited target for people bullish on Crypto, and after admitting that the timing is getting rather tight, Jenkins informed that CoinList itself now suggests that the $100k target for ETH might not come until sometime in 2022. Moreover, some analysts are backing Ethereum to surpass the gains of Bitcoin percentagewise, as former Goldman Sachs executive and crypto investor, Raoul Pal, stated that Bitcoin lacks the intensity ETH has. He stated, “[Bitcoin] just doesn’t have the network intensity that Ethereum does…Bitcoin has nothing like that going on.”

Cardano Technical Analysis (November 2021)
The co-founder of Ethereum, Charles Hoskinson, is also the creator of Cardano, a decentralized blockchain that launched in 2017. Cardano’s dual mission is to become the most environmentally sustainable crypto having a blockchain network that is easily scalable. When compared to other Cryptos, Cardano’s mining process consumes less energy, and its native currency is the ADA digital token. This token gets its name from the first computer programmer – Ada Lovelace. The ADA is an open-source platform, so that anyone can develop it further. Cardano Market Analysis: Cardano launched January 2017 at $0.0024, and it was listed on the Crypto exchanges from October 2017 for $0.002. Cardano (ADA) is now trading at $2.04 with a daily volume of more than $3.7 billion and a market cap of more than 470.5 trillion. The number of ADA coins in circulation is about 33.3 billion coins, with a maximum supply of 45 billion ADA coins. Cardano can be purchased from the major Crypto exchange platforms including Binance, Coin Tiger, Coin base, and KuCoin. Incidentally, investors who bought and held Cardano from its launch have an 88650 % increase in their investments.
Cardano Short-Term Technical Analysis: taking a look at the financial charts, Cardano has been in a long-term bullish trend since July 25th. It reached an all-time peak of $3 in September, and thereafter, the price has been at a retracement. However, a closer look reveals that the bearish retracement has been reducing in energy and volume. The indicators at the bottom of the chart shows that the candles in the retracement have long wicks and small bodies, meaning the bearish rally is almost over. So far in November, there have been only very small candles, and analysis will show that Cardano’s prices are consolidating at a range between $2.2770 and $1.8300. This is a sign that the prices are collecting contracts for a long bullish trend. Currently, the price is bouncing on a support level of $1.83004 and a psychological level of $2.0000. Because the price has tested this support level twice already without breaking it, there is a likelihood that the price will bounce off this level once again and this time around, continue with the long-term bullish trend. If the price breaks the support level of $1.83004, it will go to the support level of $1.4733, where there is an unclaimed demand zone, in which case it will continue then to be bullish. However, as stated above, the price has a high chance of going bullish from the support level of $1.83004 because that level has been tested.
Cardano long-Term Technical Analysis: As per the financial charts, long-term Cardano sentiment has been bullish since July 2018. Currently, the price is in a bearish retracement after hitting an all-time high of $3. This retracement might be ending as the price is finding support at the $2.000 psychological level. Charts show a strong resistance level at $1.8300 that has been broken and has turned into a support level. Since this level has held price more than five times, there is a high probability that the price will not cross it. Long-term market sentiment is bullish and it seems then, that Cardano is a good investment for both traders and investors.

Ethereum Whale Just Purchased $6,867,089.61 Worth of SHIB
Ever since Shiba Inu’s (SHIB) total value locked (TVL) rose to $2 billion, the coin has become a bullseye for investors; and in fact, late last week, an Ethereum whale purchased $6,867,089.61 worth of SHIB. This value translates to about 165 billion SHIB, and this new development, whose transaction details can be found on Etherscan, has rocked Twitter. Crypto enthusiasts on that platform cannot help but anticipate that something big is about to happen to the popular alt coin. The last time an anonymous whale bought about 6.3 trillion coins, it was a sign that something big was about to happen, because a couple of weeks later, the Shiba Inu token went bullish and hit a new all-time high. Crypto analysts now assume the new whale knows about a coming bull market to have bought such a huge amount of SHIB. This new buy comes just after another anonymous Ethereum whale went on a SHIB shopping spree, buying close to 276 billion SHIB about two weeks ago. This whale’s purchase came after SHIB experienced an impressive 340% surge during the last week of October.
That surge had the coin hit a new all-time high of over $0.000046. The specific whale who purchased the 276 billion SHIB two weeks ago is said to currently possess around $13,448,334 in Shiba Inu tokens, according to transaction details by whalestats.com. SHIB is experiencing an interesting development following the most recent surge, which had resulted in a record all-time high of 0.000057. The price increase was attributable to inflows of $4.64 billion on October 23 and 24. This then led to an increase of the total amount of money in the market from $11.02 billion to $15.66 billion. Current speculation is rife with the possible rise of the Shiba Inu token, and should this be the case, the coin will rise even further up the list of the top 10 cryptocurrencies.
BTC/USD Bulls Eyeing 64999 Technical Resistance: Sally Ho’s Technical Analysis for BTC for November 7 2021
Bitcoin (BTC/USD) remained top-heavy early in the Asian session, and the pair remained at risk of encountering more selling pressure following some recent failures to test the 64793.55 and the 64999.14 levels. These levels represent a 76.4% and 78.6% retracement of the recent depreciating range from 66,999 to 57,653.88. The pair has orbited the 60804.26 area for several trading sessions, and that price represents the 23.6% retracement of the appreciating range from the 40750.12 point to the 66999. Additional downside retracement levels in this appreciating range include the 56971, 53874, 50777, 46944, and the 46367 levels. If BTC/USD is able to regain upward momentum, additional upside retracement levels include the 648989 and the 65094.61 levels. BTC/USD recently tested the 58265 level multiple times, and this represented a downside price objective related to selling pressure that recently intensified around the 63750 level. Following the pair’s recent gains, downside retracement levels and areas of potential technical support include the 56593, 57627, and 56293 levels.
Traders observe that the 50-bar MA (4-hourly) is bearishly indicating below the 100-bar MA (4-hourly) and above the 200-bar MA (4-hourly). Also, the 50-bar MA (hourly) is bullish, indicating above the 100-bar MA (hourly) and above the 200-bar MA (hourly). Price activity is nearest the 50-bar MA (4-hourly) at 61605.83 and the 200-bar MA (Hourly) at 61549.72. Technical Support is expected around the levels of 53997.15, 51245.86, and 49022.22 with stops expected below. Technical Resistance is expected around 67146.16, 68515.32, and 69449.40, with stops expected above. On 4-Hourly chart, SlowK is Bullishly above SlowD, while MACD is Bearishly below MACDAverage. On 60-minute chart, SlowK is Bearishly below SlowD, while MACD is Bullishly above the MACDAverage.
The post <h5>Digital Asset Insights #40</h5> <h3>Will Shiba Inu Keep Rising?</h3> appeared first on JP Fund Services.
Tradersdna is a leading digital and social media platform for traders and investors. Tradersdna offers premiere resources for trading and investing education, digital resources for personal finance, market analysis and free trading guides. More about TradersDNA Features: What Does It Take to Become an Aggressive Trader? | Everything You Need to Know About White Label Trading Software | Advantages of Automated Forex Trading


