This week’s digital asset newsletter illuminates the vigorous performances shown recently by the established Cryptos.

BITCOIN (BTC)
At the opening of the week, Bitcoin, the largest cryptocurrency surged above $41,000. This upward momentum was a significant gain following a dip below $37,000 last week. On Sunday, February 6, it neared $42,000 and its market capitalization was close to $800 billion once more. The layer payment system reached a total of over 3,400 BTC locked which is equivalent to around $141 million.
On Monday, Bitcoin settled above the $40,000 level against the US dollar. The rise was consistent as it accelerated further above the $42,650 resistance zone. This climaxed to a 15.58% high in seven days to hit $42,784 during intraday trading. It faced resistance at $43,000 as it failed to break above the price on Monday. However, this is the highest rise in 2 weeks causing fears to wane in the Bitcoin market community. The cryptocurrency surpassed its 50-day average for the first time since November which is an indicator that there is a potential of Bitcoin going upwards.
It was speculated on February 8 that BTC might surpass the $45,000 resistance zone as the pair continued to rise. BTC gained bullish momentum above the $43,000 level and settled above the 100 hourly simple moving average. It traded above the 23.6% Fib retracement level of the recent increase from the $41,141 swing low to $44,528 high.
By the 10th of February, Bitcoin’s price had risen past a crucial barrier overnight on Wednesday, reaching $45, 300, before falling as the broader market dipped in early trades after US markets opened. Within 24 hours, BTC/USD moved in a range of $43,402.81 to $45,398.91, exhibiting high volatility. Trading volume climbed by 16.21% to $28.8 billion, while the overall market cap was around $860.47 billion.
However, on Saturday, the bearish momentum was lost as the coin hovered at $43,111 retreating toward the 9-day and 21-day moving averages. At the close of the week, the path of least resistance is still downwards, and the daily chart shows that the formation of bearish may come into play. The total capitalization was down below $2 trillion once again, as the Bitcoin price dropped to a low of around $41,900.
The week has been a roller coaster on the cryptocurrency market. BTC tested $46,000 on February 10 before steadily declining ever since. The price dipped below $42,000 and even though it managed to recover a little bit, it was down about 2% at the close of the week.

ETHEREUM (ETH)
Ethereum recovered above $3100 on February 7 and it continued an uptrend towards the resistance level of $3300. It remained in a bullish position and, according to analysts, it was likely to follow a bearish sentiment as it broke below the 9-day moving average. More so, on February 9, ETH/USD posted incredible gains after a successful daily trading season. In addition, the Ethereum bullish action remained above the $3000 resistance level as it climaxed at $ 3274. It closed the day at $3248 level as the bulls were making effort to push it above the upper boundary of the channel.
On Thursday, Ethereum eyes a 14% upswing despite facing a stiff resistance barrier at $3413. It flipped a crucial barrier as it experienced a massive uptrend which was suggestive of an increase in buying pressure. This exponential ascent pushed ETH to produce a daily candlestick close above the 50-day Simple Moving Average (SMA) at $3,196.
Towards the end of the week, however, starting from Friday, Ethereum started a consistent downside correction after it spiked towards $3,300. It traded below $3,100. According to analysts, the drop was attributable to falling asset prices. Lower asset prices result in poor performance for put-selling vaults and a “flight to safety” amid the market volatility, causing investors to withdraw capital from risky option vaults.
On Saturday, Ethereum’s price faced the same selling pressure as the rest of the cryptocurrency market. It traded below $3k, charting a decline of about 5%.

THE RIPPLE (XRP)
The Ripple price renews the bullish trend after crossing above the moving averages to touch the daily high at $0.80 on February 7. It moved towards the resistance level of $0.85 with the potential to create additional highs which climaxed at $0.91.
On Tuesday, XRP was up over 48% as it traded at $0.88. It emerged as the 3rd top gainer among the top 50. It surpassed ADA and SOL with a market cap of $42.18B and became the 6th largest cryptocurrency in the world. According to data from CryptoRank, XRP grew 5.62% in 24 hours.
However, on Friday, XRP/USD began a steady decline towards the support level of $0.75 after struggling to reach the $0.91 high. It closed the week exchanging hands at $0.77, and an attempt to cross below the 9-day moving average may likely bring it towards the 21-day moving average. It is speculated that if the price fails to rebound, a bearish breakout is likely to trigger more downfalls for traders, which might cause the price to touch the nearest support and further drop to $0.65, $0.60, and $0.55 support levels.
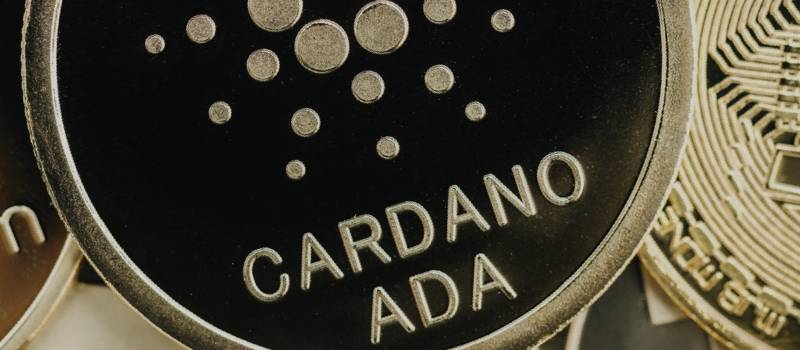
CARDANO (ADA)
Cardano was overtaken by XRP in terms of market capitalization as of February 9. ADA was ranked seventh on CMC’s list with a market cap value of $39.72 billion. Cardano seemed to be on a slippery slope as it slightly lagged behind XRP. This week, ADA opened with an uptrend having gained over 8% in 24 hours. It traded at around $1.21 on Monday and it gained 16.2% in a week.
On Wednesday, 9 February, Cardano was the most active Blockchain network in the crypto space after Bitcoin. The coin hit a new milestone on processing over 30 million transactions on its Blockchain. It traded at $1.19 on Thursday. The network averaged 200,000 daily activities this week and this spike in activity is believed to have been caused by an increase in the number of decentralized applications on the Cardano Blockchain. This week, it posted 14% gains over last week’s price.
Nonetheless, on Friday 12 February, Cardano was down over 25% from February 5 swing high of $1.26. Bears pushed ADA back into the $1.00 support range, with buyers continuing to support price. ADA price continued on its prevailing downtrend as the buyers are nowhere to be found on Saturday. It neared a critical support line which could determine the token’s next move as slipping below the level would put a bearish target at %0.80 on the radar.
Cardano price formed a descending parallel channel on the 3-day chart, suggesting that ADA is sealed in a downtrend. The last line of defense for Cardano price before additional bearish moves are anticipated is at the 200 three-day Simple Moving Average (SMA) as $1.03

SOLANA (SOL)
At the opening of the week on Monday, 8 February, Solana price action tested its final primary resistance zone at the $120 value area. But on the following day, the price retraced 11% after encountering the bearish breaker, extending from $115.51 to $144.70. It saw a slow reversal of the overall downtrend after retesting a crucial support level. The downswing found support at the $110.03 barrier and established a directional bias.
On Friday, Solana’s price starved off another significant capitulation move _a condition it has been flirting with since late January 2022. It decreased by 4% within 24 hours. On Saturday, the price of the coin presented a buying opportunity as it dropped to a critical level of support before resuming its prevailing uptrend. The coin prepared a major rally toward $130 as a technical indicator suggests that SOL may have formed a local bottom. As of Sunday morning, February 13, the coin, ranked as the 8th largest cryptocurrency, is priced at $96.36 and has begun a slight upward push at 0.71%.
AVALANCHE (AVAX)
AVAX price took multiple breathers over the week, which cumulated into an exponential move. Its price rose 43% in the first 5 days, setting up a local top at $94.17. During the impressive run-up, Avalanche bulls had to retrace multiple times before reaching the recent swing high. On Tuesday, the altcoin surged 8% in four hours facing off against the 50-day Simple Moving Average (SMA) and 100-day SMA at $88.99 ad $93.86.
At the close of the week, the altcoin was at risk of a correction following an 80% rise toward $95 from the January low at $53. Although the Avalanche bulls benefited from the recent uptrend, the token has the potential to fall toward the lower boundary of the governing technical pattern at $73. Currently, it is exchanging hands at $82.19 and ranked as the 11th most popular cryptocurrency.

BINANCE (BNB)
On Monday, Binance Coin price faced some selling pressure as it set to break its downtrend since December, but price action faded on Tuesday, and bears sprang a bull trap. BNB sees bulls climbing out of the ditch after a positive open across the board in ASIA PAC and European indices. It was speculated that it could hit $452 by the end of the week, bringing about 10% gains to portfolios.
On Friday, Binance Coin price retested the declining trend line for the fourth time since December 28, 2021. It consolidated under a declining resistance level and a support level at $407.7. On Friday, it hung by a thread at the critical psychological and technical support at $400 and went down about 3.3% during the same time. In the wake of Sunday, February 13, the coin was exchanging hands at $403.80 with a 0.34% increase from the previous day.
ALTCOINS

TERRA (LUNA)
At the end of the past seven days, Terra’s price upswing slowed down as it approached the $62.76 to $70.52 supply zone. This is the fifth consecutive green candlesticks since February 3 and it signals a surge in bullish momentum. Flipping this hurdle to a foothold will trigger a run-up to $87.85. Ranked by coinmarketcap as the 9th most popular cryptocurrency, it is was on a 1.31% uptrend at the close of the week trading for $53.05

AXIE INFINITY (AXS)
At the end of the past seven days, Terra’s price upswing slowed down as it approached the $62.76 to $70.52 supply zone. This is the fifth consecutive green candlesticks since February 3 and it signals a surge in bullish momentum. Flipping this hurdle to a foothold will trigger a run-up to $87.85. Ranked by coinmarketcap as the 9th most popular cryptocurrency, it is was on a 1.31% uptrend at the close of the week trading for $53.05

SMOOTH LOVE POTION (SLP)
SLP skyrocketed as it tripled in value in a matter of days this week. As of Saturday, 12 February, SLP was selling for $0.027 with an hour range of 0.024 – 0.032. The in-game currency has a market capitalization of $927, 503, 521 and a trading volume of $1,365, 400, 410 in 24 hours. At the end of the week, it ranked as the 102nd largest cryptocurrency by market value.
The post <h5>Digital Asset Insights #54</h5> <h3>Bitcoin’s Parabolic Movement, Now What? </h3> appeared first on JP Fund Services.
Tradersdna is a leading digital and social media platform for traders and investors. Tradersdna offers premiere resources for trading and investing education, digital resources for personal finance, market analysis and free trading guides. More about TradersDNA Features: What Does It Take to Become an Aggressive Trader? | Everything You Need to Know About White Label Trading Software | Advantages of Automated Forex Trading


