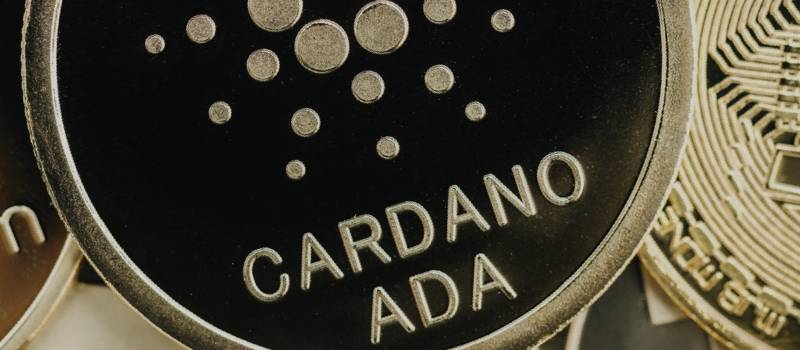
Here is what to look out for in the Crypto Market as the Trading Session Starts.

BITCOIN (BTC)
At the opening of the week, Bitcoin started a fresh increase above the $45,000 resistance against the US Dollar. It even broke $47,000 with positive signs of a continuous uptrend. The price traded above $45,500 and the 100 hourly simple average on Monday. There was a major bullish trend line formed with support near $45,200 on the hourly chart of the BTC/USD pair. It opened doors for more upsides above the $46,500 level and even jumped near $47,561 before it started consolidating gains.
On March 28, BTC/USD rallied to a new high of $48,192 as Bitcoin battled $48k resistance. However, for the next three days, Bitcoin bulls were trapped below the $48,000 resistance zone. The market retested the historical price level of January 2, 2022. Bitcoin regained bullish momentum as it retested the $48,000 resistance level as the market declined to the low of $33,855 on January 22.
However, Bitcoin dropped $2000 from $47,500 to $45,000 in four hours on the last day of the month after news broke that the EU is set to cripple innovation in the Blockchain space. On 31st March, the European Parliament voted in favor of outlawing ‘unhosted wallets’ within the European Union. An unhosted wallet is a non-custodial wallet managed entirely by an individual such as Ledgers, Trezor, SafePal, MetaMask, Trust Wallet, MEW, and many others.
Going into the new month, Bitcoin failed to stay above the $46,000 support against the US Dollar. BTC was down over 4% and there was a move below the $46,000 support. The price traded below $45,500 and the 100 hourly simple moving average. There was a break below a key breakout pattern with support near $46,800 on the hourly chart of the BTC/USD pair.
As of Sunday, April 3, 2022, Bitcoin has failed to break the $48,000 resistance level since March 28 as Bitcoin risks decline to $42,000. Buyers pushed the cryptocurrency to the high of $48,192 but were repelled as it declined to a $45,190 low and resumed a range-bound move between $45,400 and $48,000 price levels. Following the rejection at the $48,000 resistance level, BTC is now in a range-bound move as the price fluctuates between $45,400 and $48,000 price levels. Bitcoin corrected upward but was repelled at $47,200. The largest cryptocurrency will be trading in a tight range between $45,400 and $47,200 price levels.

ETHEREUM (ETH)
ETH/USD appears bullish above the $3,400 level at the beginning of the week. According to the daily chart, ETH/USD is seen trading at $3467 after recording an intraday high at $3483 during the European session on March 29. From the daily chart, it is obvious that Ethereum failed to follow in the footsteps of Bitcoin (BTC) as its margin of gains has been limited. ETH/USD still opened the week above the 9-day and 21-day moving averages after recovering from the daily low of $3334. Moreover, since the beginning of the month, the 29th of March was the day the Ethereum price touched the monthly high of $3,400.
On March 30, Ethereum’s price stalled near the critical $3,500 level, consolidating between $3,300 and $3,500 which analysts believe is likely going to continue until early April. Ethereum price had some difficulties cracking the $3,500 resistance level.
On March 31, the Ethereum price was at a crucial support level that could determine where the coin will be heading in the negative move. ETH/USD follows in the footsteps of the flagship cryptocurrency as the coin dropped towards the 9-day moving average. The Ethereum price failed to create a new high above the resistance level of $3400. According to the daily chart, the Ethereum price experiences a slight spike in profit-taking after creating a daily high of nearly $3500. However, the increasing selling pressure brought the price to touch a new low at $3336.
At the close of the week, the Ethereum price leads the way to a new bull run. ETH soars to a 3-Month High after dropping to around $3,300. A 6% increase pushed the second-largest cryptocurrency to just under $3,500.

RIPPLE (XRP)
At the opening of the week, the XRP price breached the parallel channel for the 4th time as the price hovered above the broken daily trend channel at $0.89. The Ripple price was the center of the crypto world’s attention as the bulls breached past a breakout level and the weekly parallel trend channel. This was super bullish for the remittance token as the fourth touch of a trendline is often referred to as the catalyst before a rally.
On the first day of April 2022, the daily chart revealed that the XRP price remained on track to $1. Ripple price failed anticipated bull rally into the $1 zone. Ripple price was one of the only cryptocurrencies to diverge from the bullish price action in the crypto market last week. The anticipated rally was abruptly halted as the bears sent Ripple price back into the invalidation level at $0.79 on Thursday.
Going into the new week, the Ripple price is now hovering at $0.83. Traders are likely seeing the current XRP as safely respecting the overall bullish trendline. However, analysts believe that the two-day Chart points to subtle cues of further downside price action. XRP has printed a very bearish Evening Star on the two-day chart. More so, the Relative Strength Index shows a double top formation around the 60 levels, which could enable the XRP price to retest $0.74 and possibly the $0.70 zone.

CARDANO (ADA)
Cardano price has been on a rampage for over a week now as investors poured massively into the price action, prepositioning for a relief rally. ADA prices now look set to extend its uptrend as more room opens up. At the opening of the week, Cardano’s (ADA) price took a significant hurdle as bulls continued to propel the altcoin higher. Unlike other barriers before it, ADA needed a massive surge in bullish momentum to overcome it.
Cardano’s price rose roughly 53% in two weeks from $0.776 to almost retest the $1.20 resistance barrier. This exponential uptrend comes as BTC has flipped bullish in a shorter time frame, allowing altcoins to explode.
ADA price had a rough 48 hours with bulls losing some heart at the monthly R1 resistance at $1.246. ADA price was on the cusp of breaking above $1.246, constituting a 28% price appreciation before bulls hit a trifecta of bearish elements, including the 200-day Simple Moving Average (SMA) and the R2 and a historical trend line all in the mix around the same level.
On 31 March, Cardano’s price targets $2 as ADA price whales go on a buying spree. Institutional investors were pouring capital into ADA as the demands for the altcoin increased. The value of on-chain transactions over $100,000 has increased by 5,000% since the beginning of 2022.
As of March 31, Cardano’s price was taking a breather by retracing to the immediate support levels at $1.03 and $0.97. This pullback allowed sidelined buyers to kick-start a 25% upswing to a yearly open at $1.31. Cardano’s price rallied 51% between March 18 and 28, setting an upswing high at $1.24.
At the end of the week, Cardano price developed two possible trade setups for the long and short side of the market. Cardano converted into a bull market on its $0.01/3-box reversal Point and Figure chart. Cardano price has a theoretical long entry opportunity with a buy stop order at $1.19, a stop loss at $1.15, and a profit target at $1.33.
ALTCOINS

SOLANA (SOL)
On Monday, Solana’s SOL jumped as much as 14% with similar gains seen on Shiba Inu’s SHIH and Polka Dots DOT tokens. A jump in SOL prices made it costly for traders betting against higher prices of the asset. Data show nearly $30 million in liquidations occurred on SOL-tracked futures. Solana’s price breached the $100 level with ease, as it ascended into the mid $110 zone to start the week’s trading session. Breaching the triangle consolidation, SOL price has volume increasing in the bull’s favor.
The following day, Tuesday, 29 March, Solana’s price opened flat with no room for bears to try and push below $105.77. SOL price was on a path with a perfect technical playbook trade where the rally turned into an uptrend as more technical hurdles turned into support along the way.
As the week came to a close, Solana’s price trended upwards as bright skies offered $130 as the target. Solana’s price rallied 9% during the final trading hours of the week. Solana price has been an exciting cryptocurrency amongst traders in the past 7 days. Solana’s price now trades at $134. When analyzing the triangle structure, the 40% rally may be fully actualized already, as one can count a completed impulse wave into the new $134 high.

BICONOMY (BICO)
BICO is currently a trending asset as it remains on a steady rise through the week. The price of BICONOMY (BICO) has risen by 15.48% in the past 7 days. Even though there was a decline of 5.65% at the close of the week, the uptrend of 0.69% at the beginning of the new week is suggestive of its likely behavior in the week. The current price is $1.887 per BICO.

INDEX (IDEX)
Like BICO, IDEX is on the rise throughout the week. It has risen by about 14.07% in the last 7 days. However, there was a downtrend at the close of the week as the price declined by 3.09% in the final 24 hours and further shrunk by 0.37% on Sunday, 3 April 2022. The current price is $0.1877 per IDEX.
The post <h5>Digital Asset Insights #60</h5> <h3>The Best Performing Assets of the Week Will Surprise You!</h3> appeared first on JP Fund Services.


