By Martin Tarlie, Research Analyst at GMO
In the fourth quarter of 2018, the S&P 500 fell almost 14%. This large price drop occurred in spite of a strong fundamental backdrop. Earnings per share (EPS) for 2018, much of it already locked in, is expected to be about $140, a 28% increase over 2017. And expectations for 2019 are for EPS of about $156, a 12% annual increase. With fundamentals so good, what explains the recent price action?
The Bubble Model
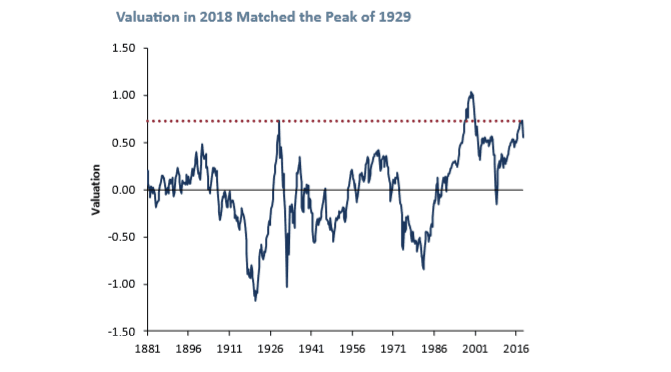
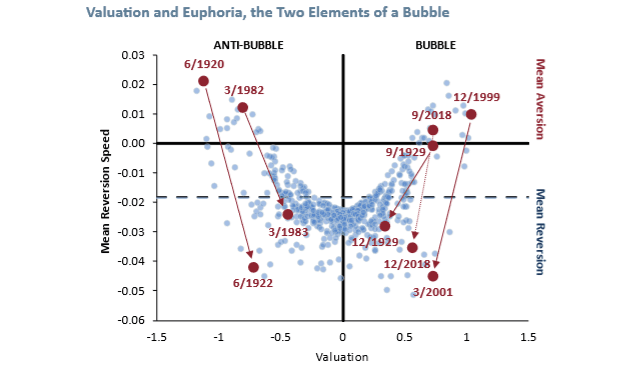
A new model – the Bubble Model – explains this dichotomy between price action and fundamentals by suggesting that a bubble in the U.S. stock market started inflating in early 2017, and continued to inflate through the third quarter of 2018. In the fourth quarter, however, indications were that the bubble had started to deflate. And when bubbles deflate, they generally do so with a volatility bang.
In this new model, bubbles are prone to form when times are good and expected to get even better. Good times today and even better times ahead are reflected in high valuations and solid fundamentals that continue to improve. Improving fundamentals lead to positive changes in sentiment, and these positive changes in sentiment fuel the bubble.
However, sentiment cannot increase forever. When change in sentiment – not level – inevitably turns negative as hopes of even better times ahead are dashed, there is nothing left to fuel the bubble. In the context of market action over the past quarter, expectations of decelerating earnings growth – albeit still positive – reflect a negative change in sentiment. Furthermore, between August and December of 2018, estimated EPS for 2019 fell from $163.51 to $156.28, a decline of more than 4%. These earnings changes could reflect negative changes in sentiment. But other concerns, such as tightening by the Federal Reserve and trade tensions with China, can also cause negative changes in sentiment. And it is negative changes in sentiment – defined broadly – that can catalyze the pop.

While there are indications that the bubble started to deflate in the fourth quarter of 2018, and the magnitude of both price action and the change in the quantitative measure of euphoria that defines the Bubble Model suggest that the odds are now tilted in favor of the view that this is the beginning of the end of the bubble, we would be well-advised to remember Yogi Berra’s counsel that “It ain’t over till it’s over.” Past bubbles do exhibit “head fakes” in which bubble deflation is interrupted by a secondary growth event. For example, in the third quarter of 1998, the time of the LTCM crisis, the Bubble Model suggested the bursting of the bubble that had started inflating in early 1997.3 However, the 1998 reading was a head fake, and the bubble continued to grow for another 18 months before finally popping in early 2000.
Is it the US Stock Market Bubble about to Burst?
The Bubble Model teaches us that bubbles form when times are good – high valuation – and expected to get even better – changes in sentiment are positive. Bubbles burst when changes in sentiment – not level – turn negative. This dynamic helps us understand how it is that during the fourth quarter of 2018 the market fell dramatically, even though fundamentals, both past and expected, looked solid. While as of December, 2018 expected EPS growth for 2019 is 12%, this is substantially below the 28% growth of 2018. Furthermore, since August, 2018 estimated EPS for 2019 has been revised downward by more than 4%. These changes, together with concerns about Federal Reserve tightening and trade tensions with China, point to negative changes in sentiment, a catalyst for popping a bubble.

Our advice when the bubble is inflating is to avoid the siren song of buying into rising prices, thus avoiding the bubble altogether. While career risk can make this course of action difficult (hence giving further life to the bubble, of course), we believe the challenge of successfully timing the exit is such that bearing the career risk is the wiser and more prudent course for those with a sufficiently long time horizon.
Currently, we are faced with a volatile market that, through the end of 2018 at least, is down double digits from the September, 2018 peak. The volatility is consistent with a bubble bursting, though we caution that it is possible that the fourth quarter move in the mean reversion speed could be a head fake. While the dramatic nature of the move in the mean reversion speed to such strong mean reversion suggests that the odds are tilted toward this being the beginning of the end of the bubble of 2017-18, we cannot rule out reflation of the bubble, analogous to the event of late 1998-2000. Given that valuation is still high, our advice, consistent with our portfolio positions, is to continue to own as little U.S. equity as career risk allows.
Tradersdna is a leading digital and social media platform for traders and investors. Tradersdna offers premiere resources for trading and investing education, digital resources for personal finance, market analysis and free trading guides. More about TradersDNA Features: What Does It Take to Become an Aggressive Trader? | Everything You Need to Know About White Label Trading Software | Advantages of Automated Forex Trading


