
In the previous installment, we looked at the five impulse waves that make up the uptrend of a typical Elliot Wave pattern, describing the phases that the investing public tends to go through with a security on the uptrend – initial interest from traders, the first selloff, interest from mainstream investors, the second selloff, and then finally the race for the top, at which point the price of the security is usually quite strongly overvalued.
At the peak of the fifth wave comes the inevitable sell-off, and this usually begins a counter-trend known as an ABC that acts as a correction for the surge in the first five waves.
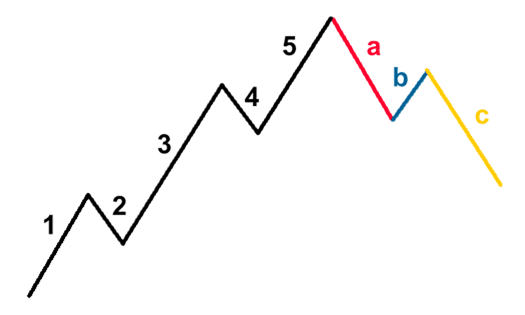
Above, you can see an example of the typical 5-3 Elliott Wave formation in a bull market. It’s worth noting that these formations occur in bear markets as well – they just tend to be upside down, like so:
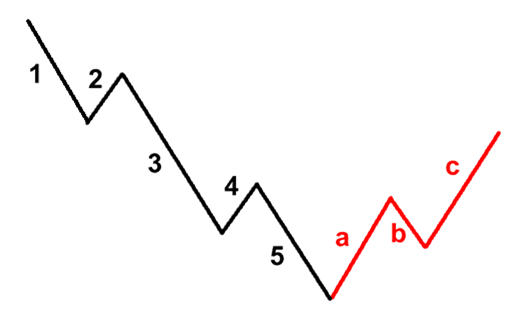
Now, if you have any prior knowledge of chart analysis, you’ll know that price charts very rarely fit into these kinds of neat structures, and Elliott was aware of this. In fact, he identified no fewer than 21 corrective ABC patterns that can occur in different circumstances, with differing degrees of complexity.
Of these 21 distinct patterns, there are three sub-categories of formations: Zig Zag; Flats; and Triangles. As with the formation shown above (in which the ABC is a Zig Zag) these patterns can also be applied to downtrends, simply by inverting them.
Zig Zag Formation
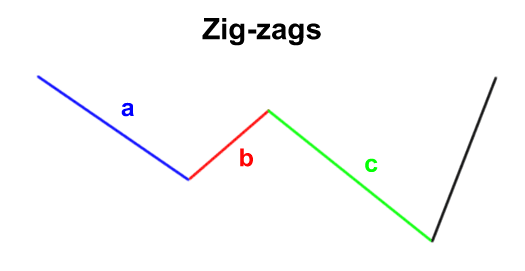
These are very steep price moves that go against the prevailing trend. In most cases wave B will be the shortest of the three, and these zig-zag patterns can happen two or three times in a correction, forming 2-3 zig-zag patterns linked together. As with all waves, each individual wave in zig-zag could be broken up into a 5-wave pattern.
The Flat Formation
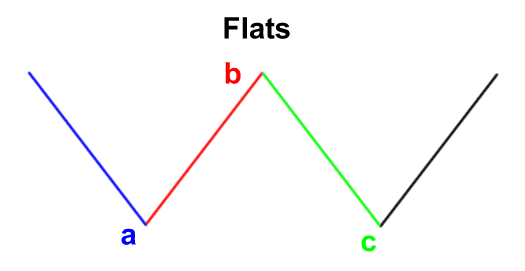
These are simple sideways corrective waves, in which the waves tend to be roughly equal in length, with wave B reversing the move of wave A and wave C reversing the move of wave B. However, wave B can sometimes go past the starting point of wave A.
The Triangle Formation
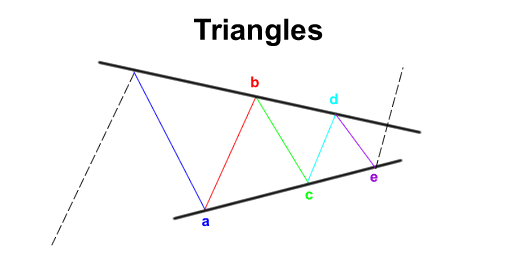
This is a corrective pattern that can be defined as being bound by converging or diverging trend lines. A triangle formation is made up of five waves that move sideways against the trend, and the triangles that they are bound in can be descending, ascending, expanding, or symmetrical.
Tradersdna is a leading digital and social media platform for traders and investors. Tradersdna offers premiere resources for trading and investing education, digital resources for personal finance, market analysis and free trading guides. More about TradersDNA Features: What Does It Take to Become an Aggressive Trader? | Everything You Need to Know About White Label Trading Software | Advantages of Automated Forex Trading


