One potential problem with using the equity markets to inform your forex trades is that it can be hard to tell which market is leading the other. Do currencies rise and fall as a result of the stock markets, or is it the other way round?
Whenever a stock market rises, confidence in the country that market is based in rises accordingly, and this should lead to an influx of funds for foreign investors. This creates a demand for the currency of that country, exerting upwards pressure on the price compared with other foreign currencies.
On the other hand, when a stock market founders, confidence falls, leading to foreign investors taking their money out of the market and converting it back into their own currencies. This exerts a downwards pressure on the price of the domestic currency.
Sounds simple, right? Unfortunately, it doesn’t always work this way, particularly in the case of the US and Japan over the past few years. Any positive economic data related to these countries has tended to pull down the value of their currencies, rather than push them up as common sense would suggest.

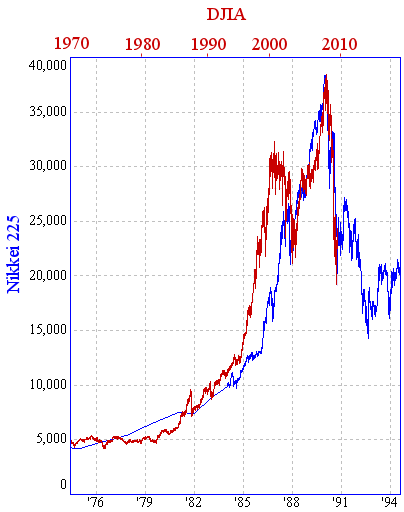
Source: Intmath.com
As we can see, these two markets have a long history of moving in tandem with each other, and their relationship has been particularly close in the last 15 years. Sometimes one index will lead the other, in that it will rally or drop first before the move is echoed in the other index. As a rule, most global stock indices more or less move in the same direction as one another, although some have a stronger correlation than others.
Prior to the global economic crisis of 2007, the Nikkei and the USD/JPY were inversely correlated. Whenever the Japanese stock market was doing well, the yen strengthened, and whenever it was doing badly, the yen would weaken, leading to a rise in USD/JPY.
However, when the financial crisis hit, this relationship was turned on its head, and now the Nikkei and the USD/JPY move in the same direction.
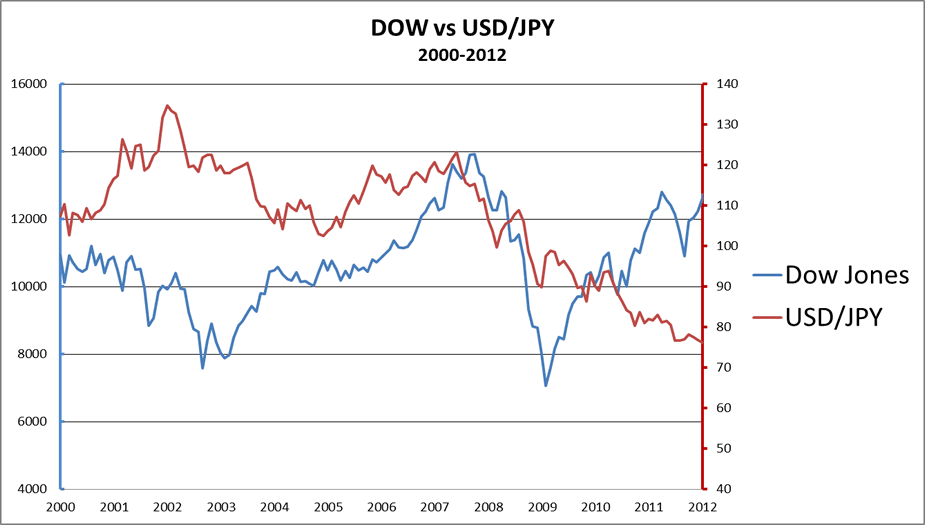
Dow Jones Correlation with USD/JPY
Common sense would dictate that the Dow and the USD/JPY would have a strong correlation, but while they undoubtedly have a positive correlation, it isn’t that strong – as you can see in the chart below:
This only goes to show that any one indicator – such as equity indices – should be taken as part of the complete picture, including sentiment, technical analysis, and fundamentals, and should never be traded on in isolation.
Tradersdna is a leading digital and social media platform for traders and investors. Tradersdna offers premiere resources for trading and investing education, digital resources for personal finance, market analysis and free trading guides. More about TradersDNA Features: What Does It Take to Become an Aggressive Trader? | Everything You Need to Know About White Label Trading Software | Advantages of Automated Forex Trading


