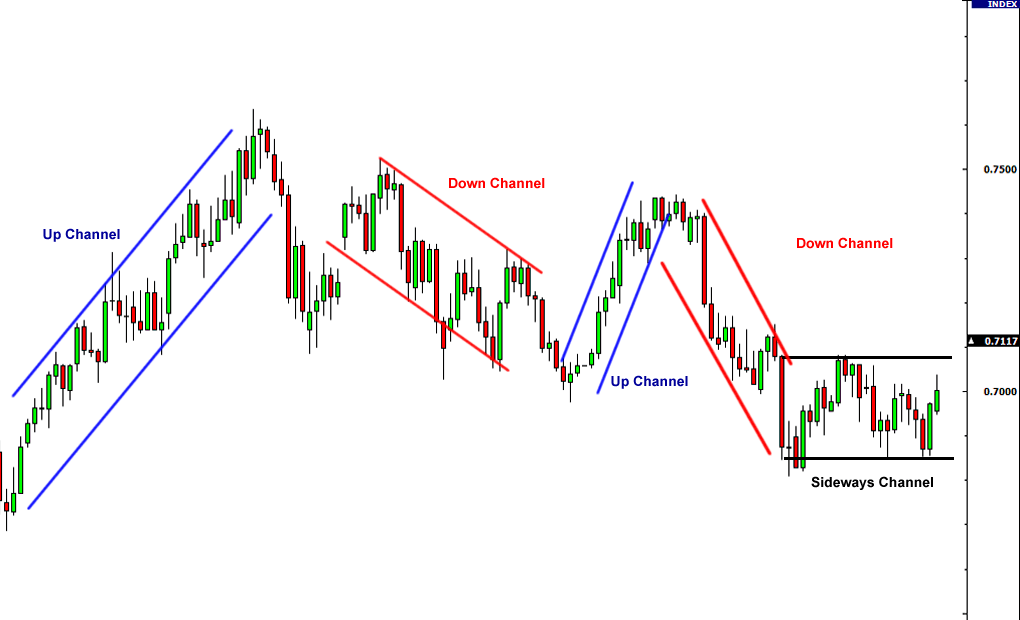
If you draw a parallel line on the other side of the waveform to a trend line, you create a channel. Channels form lines of support and resistance lines, and can be used to determine good points to buy or sell a currency pair. Here is a diagram that illustrates how to draw channels on a candlestick chart:
In order to create an up, or ascending, channel, just draw a line parallel to the uptrend line, and position it where it touches the most recent peak. This should be done at the same time as you draw the trend line.
In order to create a down, or descending, channel, draw a line parallel to the downtrend line and position it so that it touches the most recent valley.
Once you have established a trend, you can use the point at which the price hits the lower trend line as a cue to buy, and the point at which it hits the upper trend line as a cue to sell.
There are three channel types:
Up (Ascending) Channel – a succession of higher peaks and higher troughs
Down (Descending) Channel – a succession of lower peaks and lower troughs
Horizontal channel – a succession of equivalent peaks and troughs.
It is important to remember to keep the lines parallel when constructing a channel. As with trend lines, if you have to force the channels to fit, then they are not valid channels, and are therefore less likely to provide you with reliable buy and sell cues.
Tradersdna is a leading digital and social media platform for traders and investors. Tradersdna offers premiere resources for trading and investing education, digital resources for personal finance, market analysis and free trading guides. More about TradersDNA Features: What Does It Take to Become an Aggressive Trader? | Everything You Need to Know About White Label Trading Software | Advantages of Automated Forex Trading


